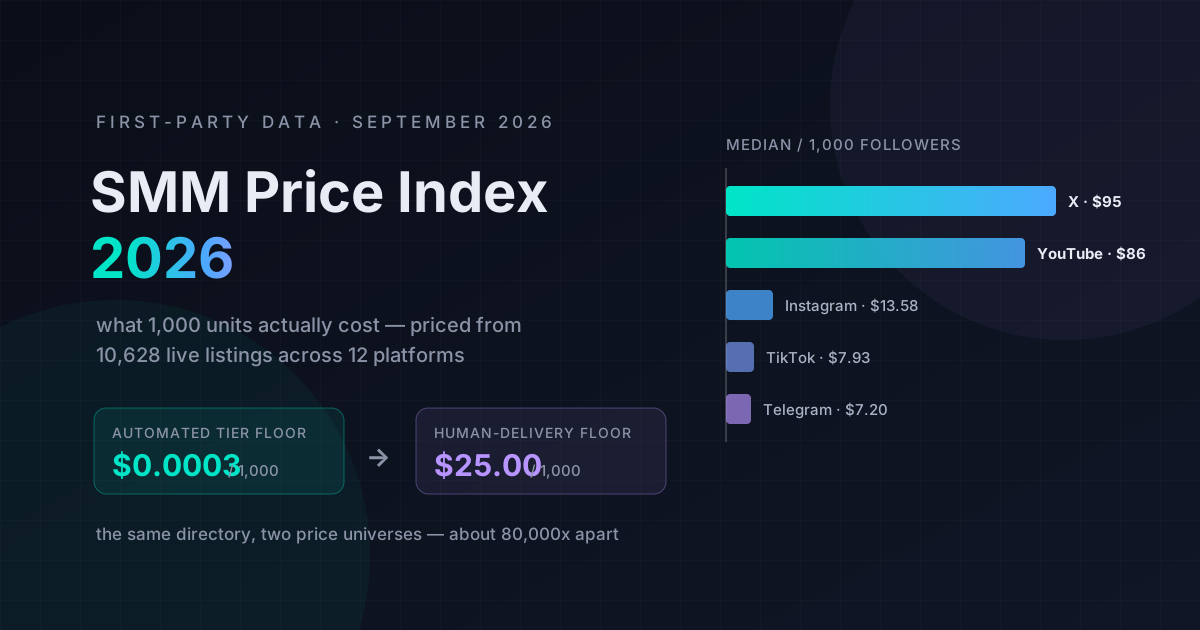
Across 10,628 live service listings on 7 SMM panels, the median price per 1,000 units in September 2026 is $13.58 for Instagram followers, $7.93 for TikTok followers, $86.00 for YouTube subscribers and $7.20 for Telegram members. Views are the cheapest thing in the market — a median of $0.16 per 1,000 on Instagram — and comments are the most expensive, at $50.94.
Those are catalogue prices pulled from the panels’ own APIs, not estimates. This index is rebuilt from the live cross-panel service search that powers this directory, and it is refreshed quarterly at this same URL.
The headline numbers are not the interesting part. The spread is.
Key takeaways
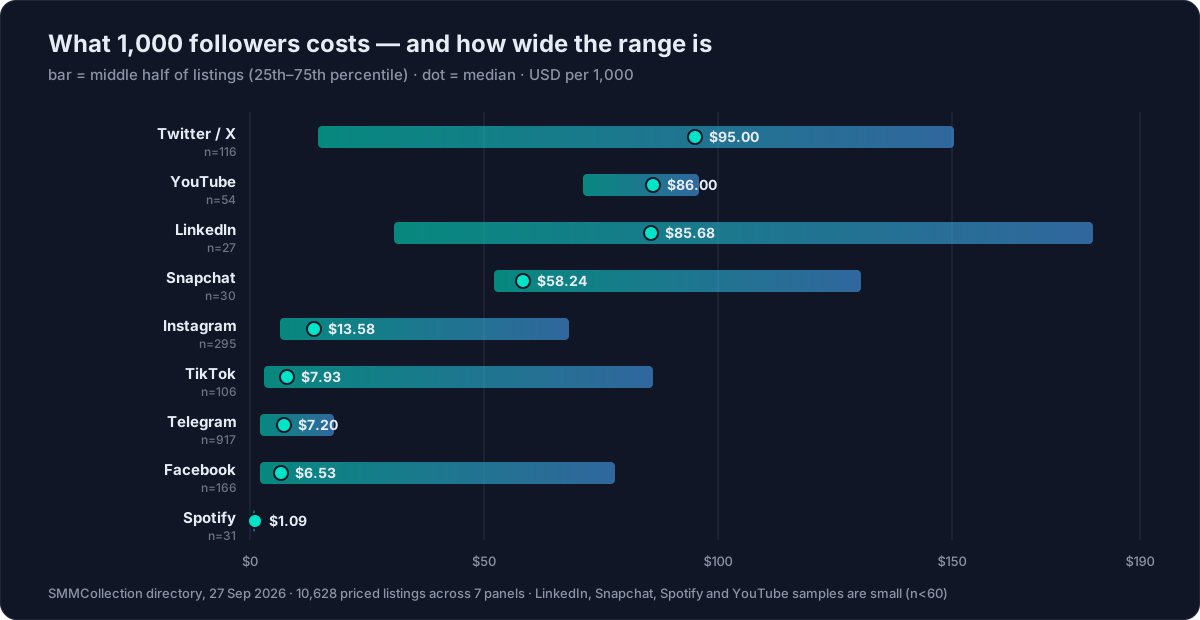
- Median cost per 1,000 followers: Instagram $13.58 · TikTok $7.93 · Telegram $7.20 · Facebook $6.53 · YouTube subs $86.00 · X $95.00.
- Views are nearly free: $0.16 per 1,000 on Instagram, $0.09 on X, $0.15 on Telegram.
- Comments cost 318x what views cost on Instagram — they need accounts that can write.
- The same product varies enormously: the middle half of Instagram follower listings spans $6.30 to $68.00, a 10.8x gap for a line item with the same name.
- Two price universes coexist in this directory: automated supply floors at $0.0003 per 1,000, human-delivery supply starts at $25.00.
- YouTube is the most price-disciplined market (subscriber quartiles sit within 1.3x of each other); TikTok is the wildest.
How this index is built
Every panel listed here connects through the standard SMM panel API, and this directory re-syncs their catalogues automatically. For this snapshot we took every priced listing from panels in approved status on 27 September 2026, classified each one to a platform and a service type from its name and category text, and computed quartiles per cell.
What we removed and why:
- Zero-priced rows — placeholders, not offers.
- Catalogue separator rows (4 of them) — entries whose “name” is a row of dashes, priced at $199,998 so nobody can order them. They are visual dividers inside a panel’s catalogue, and they would have wrecked every maximum in this report.
- Listings we could not confidently assign to a platform — about 29% of the total. These include genuinely non-social products some panels carry, such as crypto-exchange sign-up tasks.
We report the 25th percentile, median and 75th percentile rather than minimum and maximum. A single premium manual service — a verified account posting a tweet for $68,000 per 1,000 — is real, but it tells you nothing about what you will pay.
What 1,000 followers costs
| Platform | 25th pct | Median | 75th pct | Listings | Spread (p75÷p25) |
|---|---|---|---|---|---|
| Twitter / X | $14.42 | $95.00 | $150.21 | 116 | 10.4x |
| YouTube subs | $71.00 | $86.00 | $95.75 | 54 | 1.3x |
| $30.70 | $85.68 | $180.00 | 27 | 5.9x | |
| Snapchat | $52.11 | $58.24 | $130.50 | 30 | 2.5x |
| $6.30 | $13.58 | $68.00 | 295 | 10.8x | |
| TikTok | $3.03 | $7.93 | $86.00 | 106 | 28.4x |
| Telegram members | $2.17 | $7.20 | $18.00 | 917 | 8.3x |
| $2.12 | $6.53 | $78.00 | 166 | 36.9x | |
| Spotify | $0.70 | $1.09 | $1.11 | 31 | 1.6x |
LinkedIn, Snapchat, Spotify and YouTube rest on fewer than 60 listings each — read them as indicative, not settled.
The rank order is stable across the whole dataset and it follows account scarcity, not platform size. Platforms where a real account is hard to farm — X, YouTube, LinkedIn — price followers in the tens of dollars. Platforms where accounts are cheap to produce sit in single digits.
Views are nearly free. Comments are not.
Buying “engagement” is not one purchase. The four common products have prices that differ by three orders of magnitude on the same platform.
| Median $ / 1,000 | Views | Likes | Followers | Comments |
|---|---|---|---|---|
| $0.16 | $1.92 | $13.58 | $50.94 | |
| TikTok | $1.12 | $0.93 | $7.93 | $76.00 |
| YouTube | $3.36 | $6.00 | $86.00 | $61.24 |
| Telegram | $0.15 | $0.06 | $7.20 | $4.90 |
| $9.85 | $3.86 | $6.53 | $79.80 |
On Instagram, 1,000 comments cost 318x what 1,000 views cost. The reason is mechanical: a view can be produced by traffic, while a comment needs an account that can write text and survive a spam filter. The cheapest engagement anywhere in this index is a Telegram reaction at $0.057 per 1,000 — under six cents for a thousand of them, which should tell you exactly how much signal one carries.
This is also why a single “engagement rate” target is a poor brief. If you are buying to look active, views are almost free; if you are buying to look discussed, you are in a different market entirely.
Where a cheap tier even exists
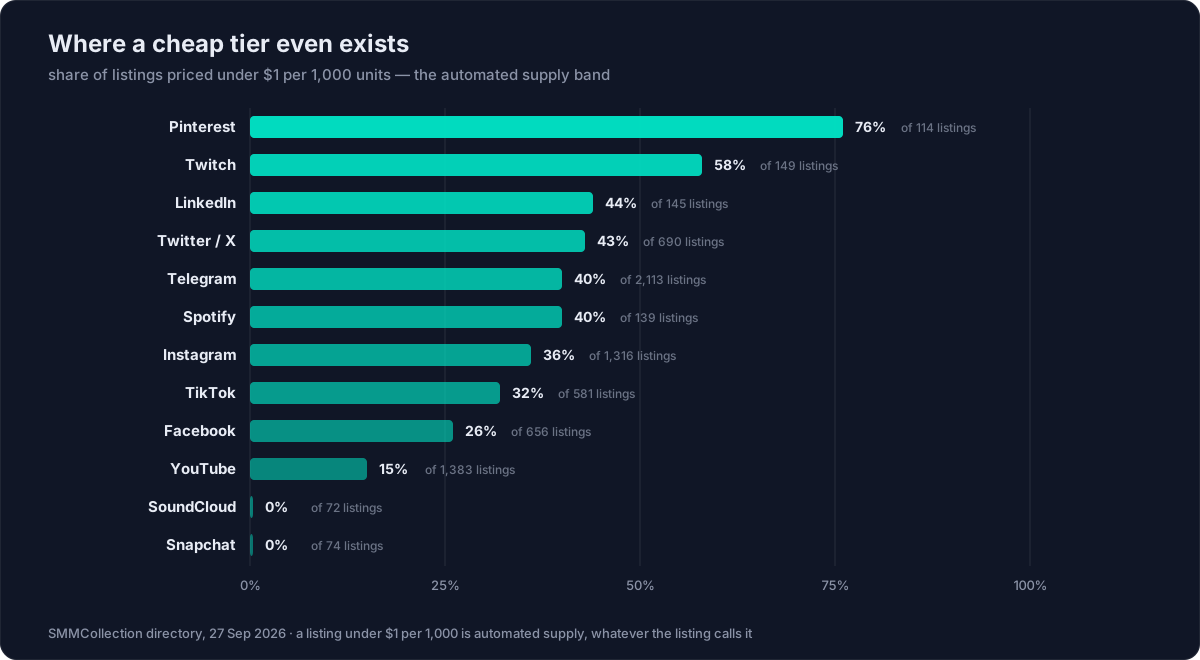
Sub-dollar pricing per 1,000 units means automated supply, whatever the listing calls it. On Pinterest, 76% of listings sit there. On Snapchat and SoundCloud, none do — every listing in this index is priced above a dollar, because nobody has built cheap automated supply for them.
That matters more than a headline price. If you are shopping for a platform where three quarters of the catalogue is bottom-tier, the median tells you about supply, not quality.
Two price universes, in the same directory
The widest gap in this dataset is not between platforms. It is between two kinds of supplier sitting side by side in the same index.
| Tier | Floor / 1,000 | Catalogue size | Example panels |
|---|---|---|---|
| Automated | $0.0003 | 1,600–4,900 listings | FansGurus, SMMKings, Boostero |
| Human delivery | $25.00 | ~360 listings | FoxiGrow, SMMfoxi |
The directory’s absolute floor is a single FansGurus listing — TikTok saves at $0.0003 per 1,000, thirty cents for a million — against a human-delivery floor of $25.00 on FoxiGrow and SMMfoxi. That is roughly 80,000x, and it is not a discount. It is a different product with a different cost of goods: one is produced by software, the other by people who have to be paid.
The two tiers also look different in shape. The automated panels carry thousands of listings because software scales; the human-supply panels carry a few hundred because people do not. FoxiGrow is currently the only panel in this directory that has passed our organic evidence audit — SMMfoxi sells on the same positioning and prices at the same floor, but has not been through that review, which is exactly the kind of distinction a price table cannot make for you.
If you have been wondering why two listings with identical wording differ by four orders of magnitude, this table is the answer. Our guide to telling organic supply from bot supply covers how to check which one you are actually buying.
What these numbers do not say
Four boundaries, because a statistic without its limits is decoration.
This is 7 panels, not the market. It is what this directory indexes, weighted by whichever panels happen to carry the most listings — Telegram looks enormous here partly because one large catalogue is heavy on Telegram services.
These are list prices, not transaction prices. Panels discount at volume, run promotions, and quote resellers differently. Nobody’s average order matches a catalogue median.
Price does not encode retention. A $0.30 follower and a $30 follower appear in the same column and behave nothing alike three weeks later. What happens after delivery is governed by refill terms, not by price — see how to read a refill policy before you order.
Classification is keyword-based. Service names are free text written by suppliers; we match platform and type from that text. It is accurate in bulk and wrong on individual oddities, and it is why 29% of listings sit outside these tables.
How to use this index
Treat the median as your sanity check, not your target. Three practical reads:
- A quote far below the 25th percentile is a supply-tier signal, not a bargain. Ask what is delivering it before you scale.
- A quote far above the 75th percentile needs a stated reason — manual delivery, a niche geo, a verified account. If there is no reason, it is just margin.
- Compare within a cell, never across. Instagram followers against Instagram followers; the platform median is a summary, not a price you should pay.
You can run any of these checks yourself: every number here comes from the same service search our visitors use, and each platform page — Instagram, TikTok, YouTube — carries its own live price statistics that update as panels re-sync. Listing on this directory is a paid product; placement in this table is not. Panels appear above because their catalogues are indexed, and the prices are whatever their API returned on 27 September 2026.
Frequently asked questions
How much do 1,000 Instagram followers cost in 2026?
The median across 295 listings in this index is $13.58 per 1,000, with the middle half of the market between $6.30 and $68.00. Listings below roughly $1 per 1,000 are automated supply; human-delivered Instagram followers start around $25 per 1,000.
Why do SMM panel prices vary so much for the same service?
Because the same service name covers different supply. Automated accounts cost a supplier almost nothing to operate, while human-delivered engagement carries real labour cost. In this index the floor for automated supply is $0.0003 per 1,000 against $25.00 for human delivery — about 80,000x for listings that can be worded identically.
What is the cheapest thing to buy on an SMM panel?
Views and reactions. The median Instagram view costs $0.16 per 1,000 and a Telegram reaction $0.057 per 1,000. Followers cost roughly 85x what views cost on Instagram, and comments about 318x, because each one requires a more capable account.
Are YouTube subscribers really the most expensive?
Among the platforms here, YouTube subscribers have the highest median at $86.00 per 1,000, and X followers are close at $95.00 on a wider spread. YouTube is also the most tightly priced market in the index: its subscriber quartiles sit within 1.3x of each other, so there is little room to shop around.
How often is this price index updated?
Quarterly, at this same URL, so the figures stay comparable over time. The underlying catalogues re-sync automatically from each panel’s API, and the snapshot date is stated at the top of every table.