Sponsored article supplied by Boostero. The data, methodology and conclusions below are the author’s; the honest-limitations section is part of the study.
Most writing about SMM panels describes the market from the outside. It lists services, compares prices, and assumes buyers want followers, because followers are the number everyone talks about.
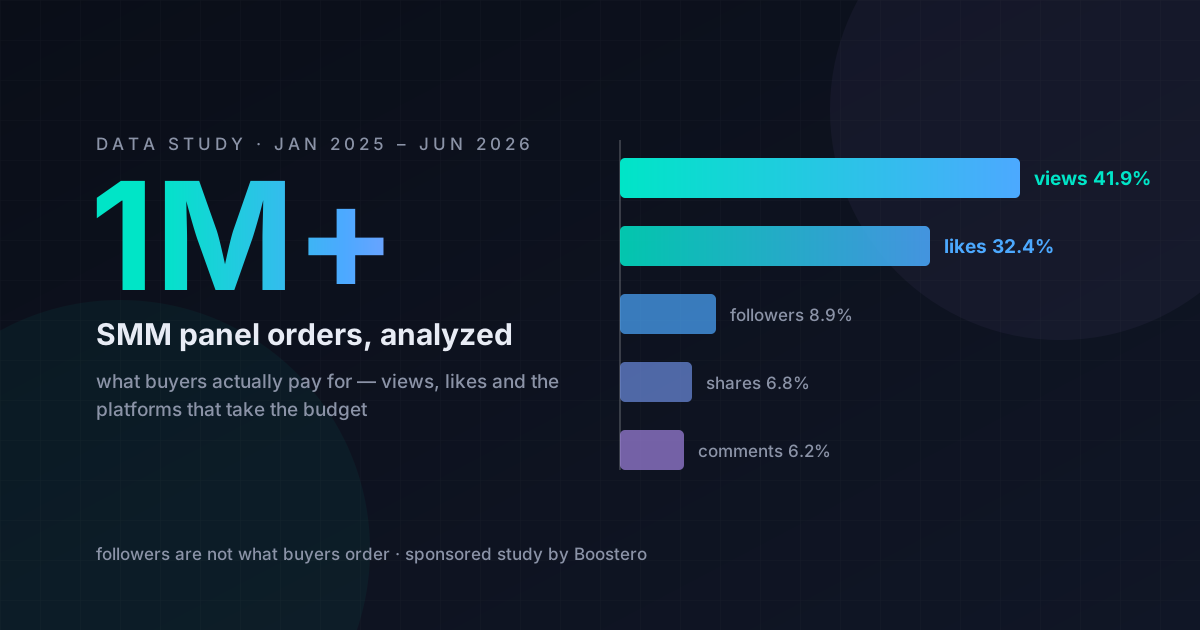
We were able to check that assumption against orders rather than opinion. Between January 2025 and June 2026, more than one million orders were placed on the Boostero platform. Cleaned of internal and test accounts, that set became a study of what people in this market actually pay for.
Here is what it showed.
Followers are not what buyers order
The single clearest finding is that follower services are a small part of the market.
Views account for 41.9 percent of orders. Likes account for 32.4 percent. Together they are close to three quarters of everything ordered. Followers account for 8.9 percent. Shares and saves take 6.8 percent, comments 6.2 percent.
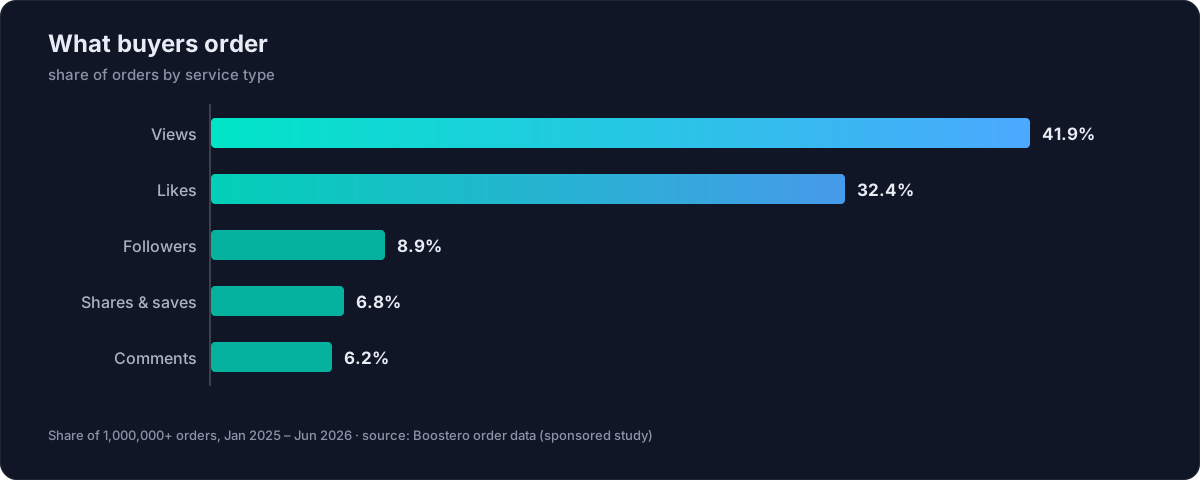
That ordering is the opposite of how the category is usually described. Read almost any comparison article and follower packages lead the page. Read the order data and buyers are spending on reach and interaction instead.
There is a reasonable explanation. A follower count is a number on a profile. Views and likes are signals attached to a specific piece of content, and content is where distribution is decided. Buyers appear to have worked out that a static number on a profile does less than early activity on a post.
Two platforms take most of the budget
Instagram accounts for 42.4 percent of analysed orders. TikTok accounts for 26.1 percent. Between them that is more than two thirds of total volume.
The rest of the field divides what remains. Telegram takes 8.4 percent, X takes 8.3 percent, YouTube 6.3 percent, Facebook 5.6 percent.
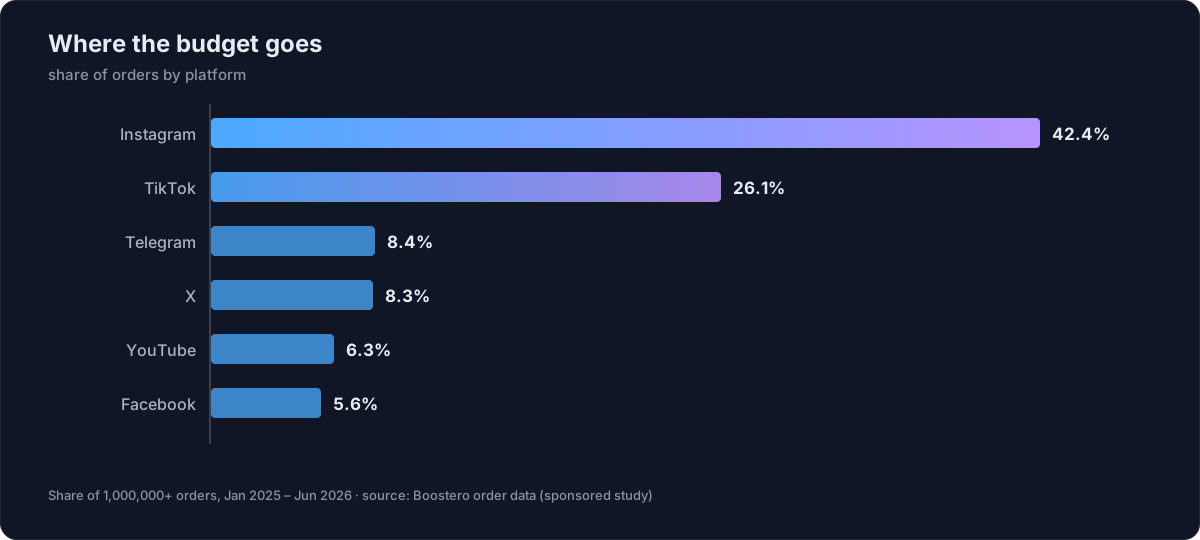
This matters for anyone choosing a panel. A catalogue advertising thirty platforms is not necessarily more useful than one that covers six properly, because the demand is concentrated. What is worth checking is whether the services on the two platforms you actually use are deep, well described and covered by refill terms, not how long the platform list is.
The geography moved faster than anything else
The United States remains the largest single market at roughly 30 percent of identified orders.
The change is underneath that. France moved from about 3 percent of identified orders to 15 percent within a year and is now the second largest market, ahead of the United Kingdom at 9 percent. Mexico, Canada, the Philippines, Germany, Ecuador, Singapore and Australia each sit in the 3 to 7 percent range.
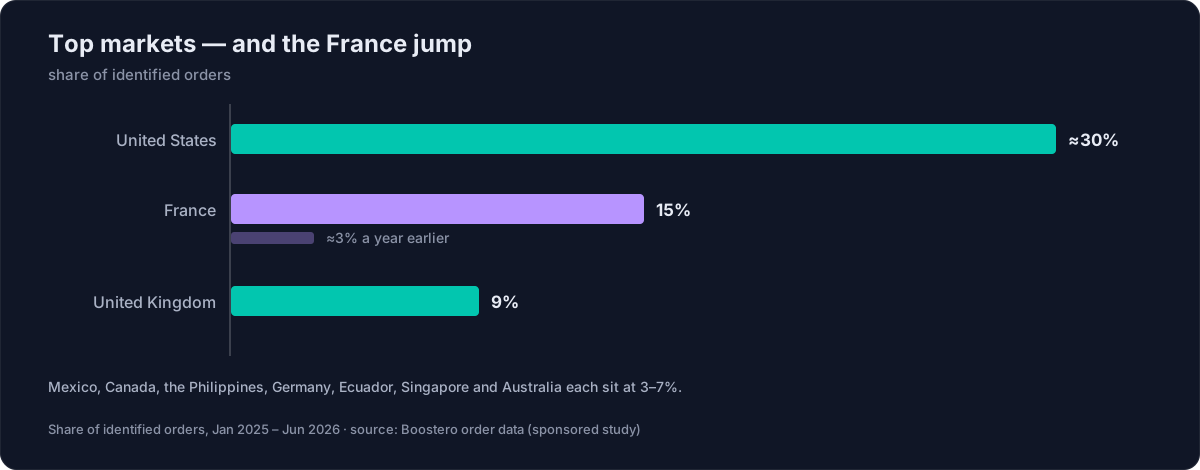
A shift of that size in twelve months is unusual in a market this mature. It suggests that demand for these services is not evenly distributed or stable, and that panels built around one region can find their traffic mix changing under them.
What the numbers do not say
Three honest limits are worth stating, because a statistic without its boundary is not much use.
This is one platform’s order data, not the market as a whole. It reflects the buyers that platform attracts, and a panel with a different customer base would produce a different mix.
It measures what was ordered, not what the orders achieved. Purchased engagement supplies signal types. What each platform does with those signals is decided by the platform, and no order data can show that.
It reports distribution shares rather than absolute volumes, which is the part that is comparable across time and across services.
Why this is worth checking before you buy
If you are choosing a panel, the useful takeaway is not which one to pick. It is that the market has already moved away from the metric most catalogues lead with. When a panel’s front page is built entirely around follower packages, it is selling to how buyers behaved a few years ago.
The services worth examining are the ones where volume actually sits: views and likes on Instagram and TikTok, with refill terms you can read before you pay. Our cross-panel service search lets you compare exactly those services side by side.
About the author
Jack runs Boostero, an SMM panel operating since 2020, with 1,600+ services across 23+ platforms and 11.9M+ orders delivered for 209,000+ registered users in 125+ countries. The full study, including every chart and the complete methodology, is published at boostero.com/smm-panel-blog/state-of-social-media-growth-2026.